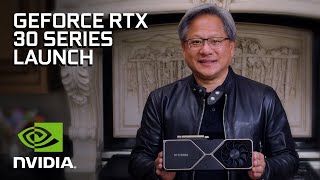

Nvidia GeForce RTX 3070 Ti
Nvidia GeForce RTX 5090
VS
Updated Nov 2026 · Scored by the Let’s Compare Data Engine · How we score
GeForce RTX 4080 Mobile wins 4 of 6 categories · GeForce RTX 3070 Ti wins 1
| Category | GeForce RTX 4080 MobileGeForce RTX 3070 Ti | Lead |
|---|---|---|
| Benchmark | +4 | |
| Theoretical Performance | +22 | |
| Memory | +3 | |
| Miscellaneous | +55 | |
| Core Specifications | +63 | |
| API Support | Tie |
Launch prices — enter today's prices (same currency for both).
| Feature | GeForce RTX 4080 Mobile | GeForce RTX 3070 Ti |
|---|---|---|
Base Power | 60 W | N/A |
Maximum Power | 150 W48% less | 290 W |
Lithography Process | 5 nm38% less | 8 nm |
| Feature | GeForce RTX 4080 Mobile | GeForce RTX 3070 Ti |
|---|---|---|
Capacity | 12 GB50% more | 8 GB |
Technology | ||
Bandwidth | 432 GB/s | 608.3 GB/s41% more |
| Feature | GeForce RTX 4080 Mobile | GeForce RTX 3070 Ti |
|---|---|---|
DirectX Version | 12 | 12 |
Vulkan Version | 1.4 | 1.4 |
| Feature | GeForce RTX 4080 Mobile | GeForce RTX 3070 Ti |
|---|---|---|
Performance (FP16) | 33.8 TFLOPS55% more | 21.75 TFLOPS |
Performance (FP32) | 33.8 TFLOPS56% more | 21.7 TFLOPS |
| Feature | GeForce RTX 4080 Mobile | GeForce RTX 3070 Ti |
|---|---|---|
G3D Mark | 24,7377% more | 23,169 |
| Feature | GeForce RTX 4080 Mobile | GeForce RTX 3070 Ti |
|---|---|---|
Platform |
Specification Note
Specifications are compiled from official manufacturer data and other reliable internet sources. Some features may vary by region or model configuration.


